Note
Go to the end to download the full example code.
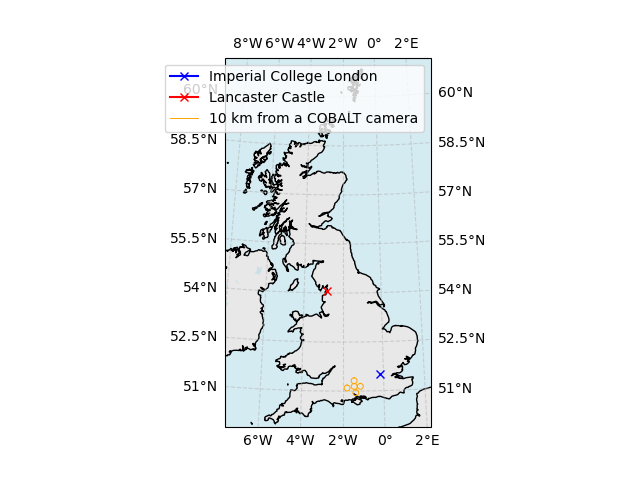
Plotting Data on a Map
This example demonstrates how to use the MapInterface to plot instrument data, such as radar scans, on a geographical map.
import datetime
from arguslib import MapInstrument, Radar, Position
from arguslib.camera.camera_array import CameraArray
from arguslib.misc.plotting import plot_range_rings

dt = datetime.datetime(2025, 3, 25, 9, 0, 0)
Plotting a Radar Scan on a Map
The MapInstrument can be used to annotate Positions on a map. We can
use it to visualise the position of other instruments.
mapper = MapInstrument.from_config("uk_wide")
ax = mapper.show(dt)  # Time is not used, but required for interface consistency
mapper.annotate_positions(
    [Position(-0.17915, 51.49934, 0.0)],
    dt,
    ax,
    color="blue",
    marker="x",
    label="Imperial College London",
)
mapper.annotate_positions(
    [Position(-2.80896, 54.05547, 0.0)],
    dt,
    ax,
    color="red",
    marker="x",
    label="Lancaster Castle",
)

multicam = CameraArray.from_config("COBALTArray")
plot_range_rings(
    mapper, multicam, None, ax=ax, ranges=[10], label="10 km from a COBALT camera"
)
ax.legend()
<matplotlib.legend.Legend object at 0x7ff08cb1cd70>
Total running time of the script: (0 minutes 23.252 seconds)